
Table Slots.
Every Glow Table is assembled from slots — the labelled controls in the bar above the table. Each dimension of your question (its choices, statements, ranks, its loop, and the filters you add) gets a slot of its own, and every slot answers the same question: where does this dimension go? Put it in the Rows, put it in the Columns, or collapse it to a single value and read everything else against that value. Two more slots — Values and Sort — control what the cells show and the order they appear in. (New to Analyse? Start with the Analysis Overview.)
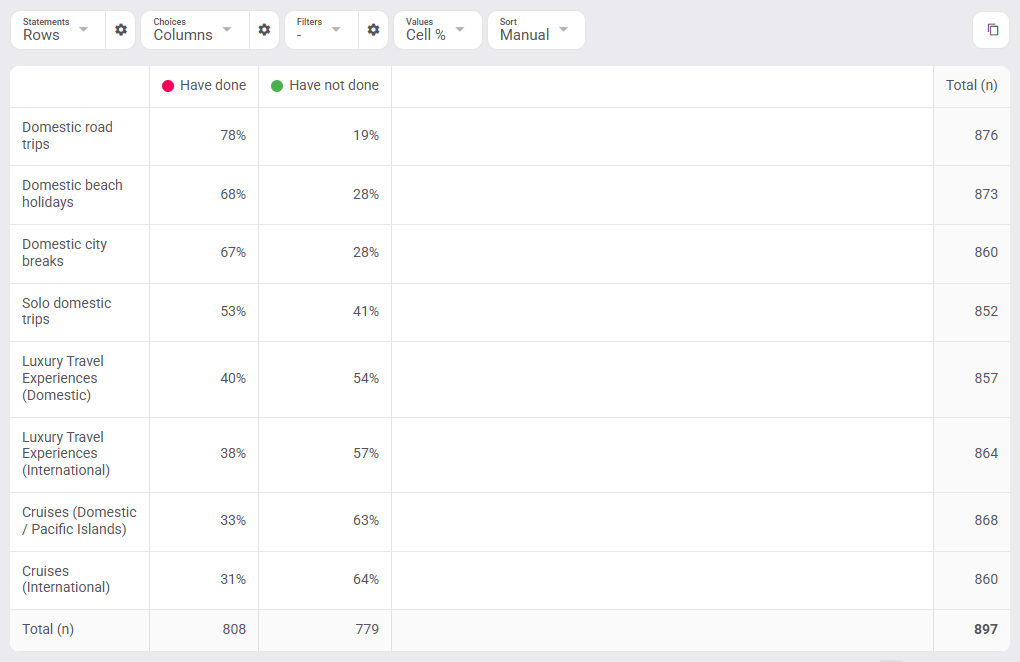
One slot per dimension
Which slots you see depends on the question type:
- Choices — the answer options. Every choice-based view has this slot.
- Statements — the rated items on matrix and score matrix questions.
- Ranks — the positions (Rank 1, Rank 2…) on rank questions.
- Loop — the loop items (one brand, one product…) on looped questions.
- Filters — the segments on the table. Always available, on every question type.
Open any dimension slot and the menu is the same shape everywhere: Rows, Columns, then the dimension’s own values listed one by one. Pick an axis to spread the dimension across it; pick a single value to collapse the dimension down to it.
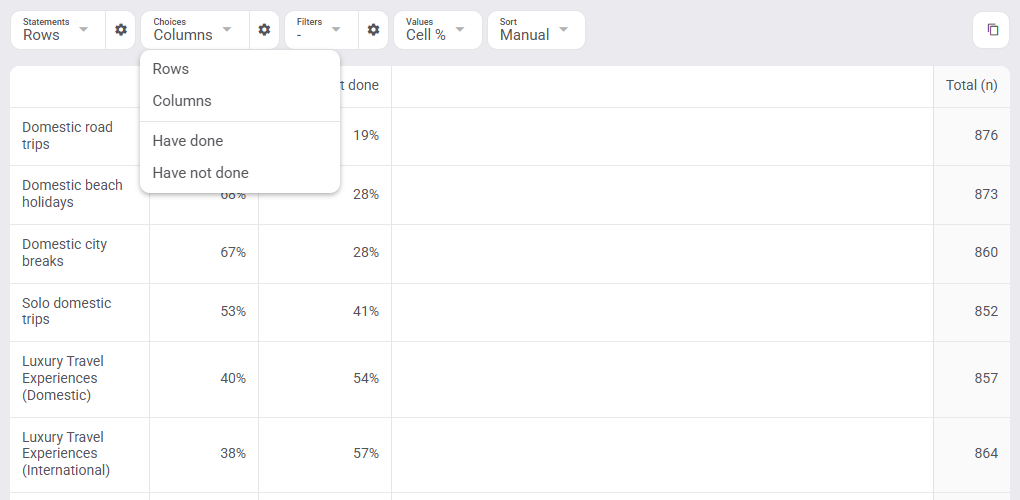
Two axes, three (or four) dimensions
A table only has rows and columns. A simple choice question has two dimensions (choices and filters), so both fit. A matrix has three — statements, choices, filters — and a looped matrix has four, so something always sits out. Whatever isn’t on an axis is collapsed to a single value, and Glow shows you exactly what, as a chip under the chart: Choice: Daily, Statement: Brand A, Loop: B.
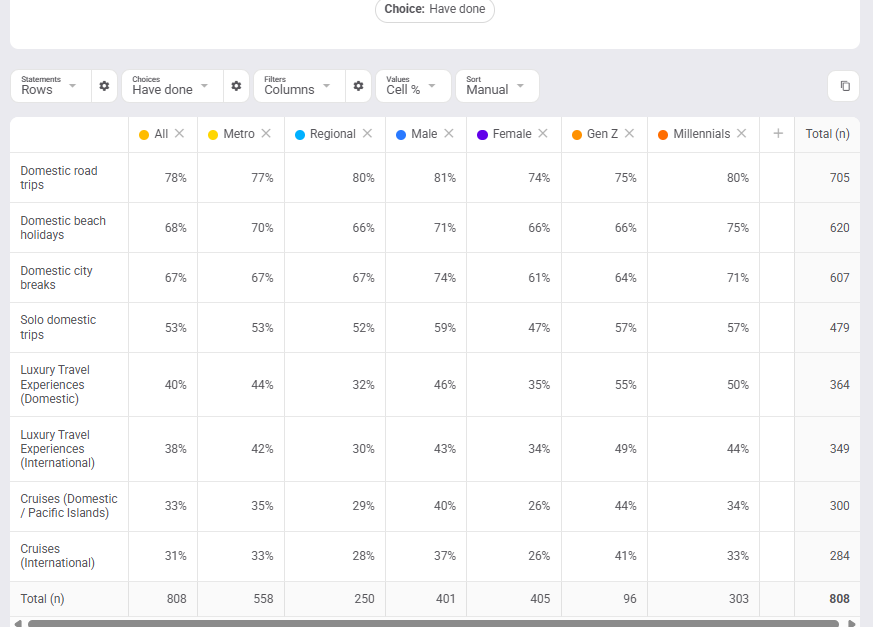
You never have to empty an axis first. Give a dimension an occupied axis and the current occupant steps aside automatically — it collapses to its first value, or to “-” for filters (the filters simply leave the table until you bring them back). It works the other way round too: collapse an on-axis dimension to a single value, and your filters step into the axis it frees. The n= in the top corner recalculates as you go: collapse a matrix to the people who answered “Daily” anywhere and the base becomes exactly those people.
The Values slot
What each cell shows: Count, Sum, Average, Cell %, Row %, Column % or Total % — and on constant sum questions, Sum % and Average (incl. 0) as well. The default adapts to the question: Cell % for choice and matrix views, Average for score questions, Sum % for constant sum. The full decision guide, with worked examples, is in Values: Count, %, Cell %, Sum & Average.
The Sort slot
Manual keeps your configured order. Row Asc / Row Desc reorder the rows by the values in a column you pick from the submenu (including the Total); Column Asc / Column Desc reorder the columns by a row you pick. The table and the chart re-sort together.

Editing the table’s make-up (merging or hiding items in a ⚙ config) returns Sort to Manual — re-apply it afterwards if you still want the ranking.
The ⚙ next to each slot
Each dimension slot has its own configuration:
- Choices / Statements / Ranks ⚙ opens the config for that dimension — rename, hide, exclude, reorder, merge, score and combine, exactly as described in Configure Choices, Statements & Loops.
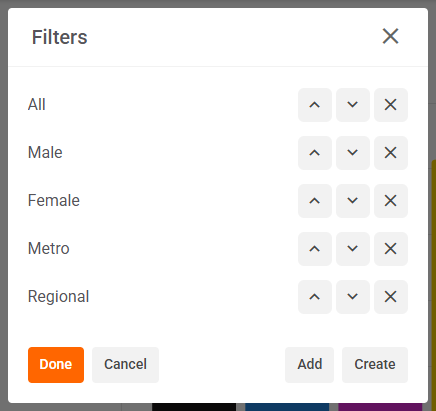
- Filters ⚙ opens the filter list for this table — reorder or remove segments, Add saved filters, or Create a new one on the spot (see Create, Import & Manage Filters). The + beneath the filter chips on the table does the adding too.
Shown base
The Shown base toggle under the table switches the Total (n) line from the people who selected each item to the people who were shown it. On questions where display logic means not everyone saw every option, the difference matters — check which base your story needs before you quote the number.
The chart follows the table
Whatever the slots build, the chart mirrors: rows become the x-axis, columns become the series, and a collapsed dimension’s chip appears under the chart. The chart-type menu (top right of the view) offers Stacked Bars, Grouped Bars, Line, Stacked Area, Spider and Pie — see Chart Types — and the rotate button flips the bars horizontal. When filters are the series, prefer Grouped Bars: segments overlap (everyone in “Male” is also in “All”), so stacking them adds numbers that were never meant to be added.
The copy button at the right of the slot bar copies the table itself — paste straight into Excel or Sheets.
FAQs
Where did the Target slot go?
Its job moved into the dimension slots. Targeting a statement is now just the Statements slot set to that statement; targeting a choice is the Choices slot set to that choice. Same analysis, but every dimension now shows exactly where it is.
Why does my Filters slot show “-”?
Another dimension took the filters’ axis, so the filters left the table. Set the Filters slot back to Rows or Columns to bring the segments back — whatever occupies that axis will collapse in turn.
Can I put the loop on an axis to compare loop items side by side?
Not in the table — the Loop slot always shows one loop item at a time; switch items in the slot (it has a search box for long loops). To eyeball several items, flip between them — the rest of your slot set-up stays put. (Loop items on an axis is on the roadmap.)
Why do Sum and Average show a wall of 1s and 0s?
The choices haven’t been scored yet. On a choice-type question, Sum and Average work on scores, so set them up first: click the ⚙ on the Choices slot, type a score next to each choice (e.g. 1–5), tick Combine Weighted, click Done — and then switch the Values slot to Average or Sum. Worked examples: Choice Analysis — Score & average your choices. (We know this switch takes a few clicks — a one-click version is on the roadmap.) Score, constant sum and numeric questions need no scoring — there Sum and Average work on the answers directly.
Does my slot set-up save?
It sticks to the view while you work, survives moving between views, and is stored when you Save the dashboard — switching dashboards discards unsaved changes (see Dashboards).