Values: Count, %, Cell %, Sum & Average.
The Values slot above your Glow Table decides what number each cell shows: a count of people, one of four percentages, or a score-based sum or average.
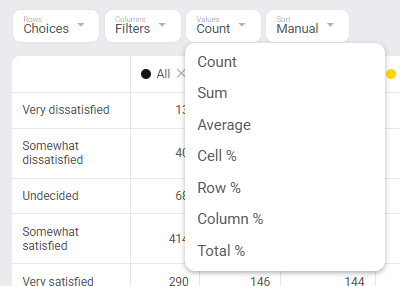
Which Value should I use?
Start from the sentence you want to say out loud, then pick the Value that answers it:
| Value | The question it answers | Example sentence |
|---|---|---|
| Count | How many people gave this answer? | "242 males were somewhat satisfied." |
| Cell % | Of the people asked, what share gave this answer? | "52% of males were somewhat satisfied." |
| Row % | How does this row split across my columns? | "58% of everyone somewhat satisfied is male." |
| Column % | How do the people in this column split across the rows? | "52% of males are somewhat satisfied." |
| Total % | What share of everyone asked lands in this one cell? | "29% of all shoppers are somewhat-satisfied males." |
| Sum | How many points (or units) does this group add up to? | "Males contributed 1,887 satisfaction points." |
| Average | What is this group's typical score? | "Males average 4.07 out of 5." |
The example we'll use throughout
Every number in this article comes from one live table: "Q37. Thinking about your checkout experience at the store, how satisfied were you with it?" cut by gender and region. 825 people answered; 464 of them are male, and 242 of those males said "Somewhat satisfied". Keep an eye on that one cell — the 242 somewhat-satisfied males — and watch what each Value does to it.
Count — "How many people?"
Count shows how many respondents gave each answer, after your filters are applied.
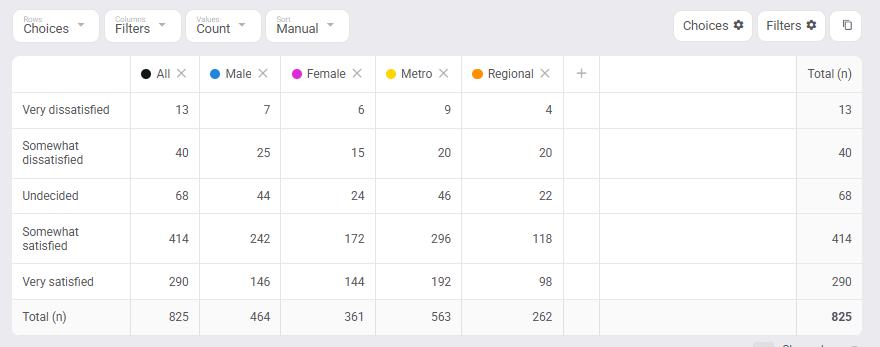
The totals around the edge do double duty — they are the denominators for every percentage below:
- The bottom Total (n) row is each column's base: how many people answered the question in that column. 825 overall, 464 males, 361 females, 563 metro, 262 regional.
- The right-hand Total (n) column is each row's total: how many people chose that answer across everyone. 414 people were somewhat satisfied.
- The bottom-right cell is the overall base: 825 people answered this question.
Cell % — "Of the people asked, what share gave this answer?"
Cell % divides each cell's count by the people who were asked that item, in that cut. 242 ÷ 464 = 52% of males were somewhat satisfied. "People asked" means everyone who answered at least one choice for that item (that statement or loop), after your filters.
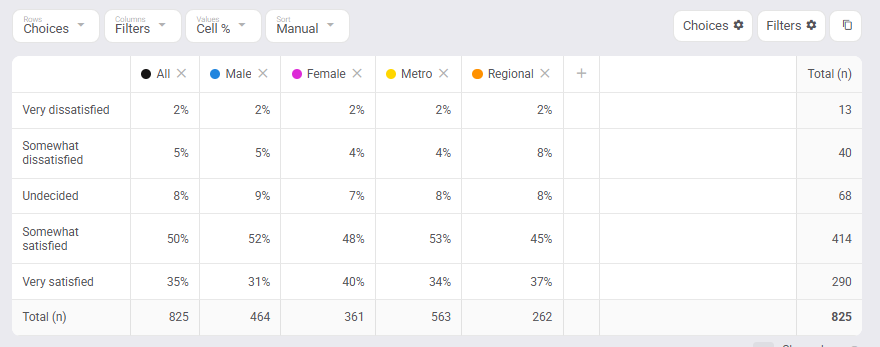
Because the denominator belongs to the cell itself — not to the row or column the cell happens to sit in — Cell % survives any table layout unchanged (see Rearranging the table below). That's why it is the default Value for new tables on percentage-based questions (Choice, Matrix, Rank, and so on). Existing tables keep whatever Value they were saved with.
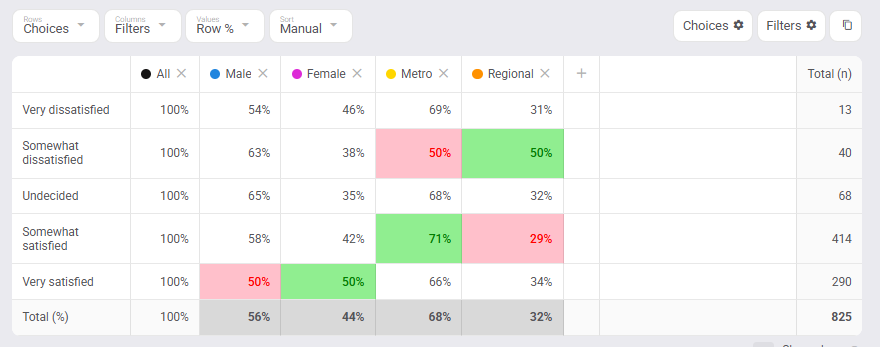
Row % — "How does this row split across my columns?"
Row % divides each cell by its row total (the right-hand column). 242 ÷ 414 = 58% of everyone somewhat satisfied is male. Use it when the row is the group you care about and you want its profile across the columns — note how Male 58% + Female 42% = 100% across each row.
Column % — "How do the people in this column split?"
Column % divides each cell by its column total (the bottom row). 242 ÷ 464 = 52% of males are somewhat satisfied — and the Male column's five answers sum to 100%. In this layout Column % matches Cell %; the difference appears the moment you rearrange the table (next section).
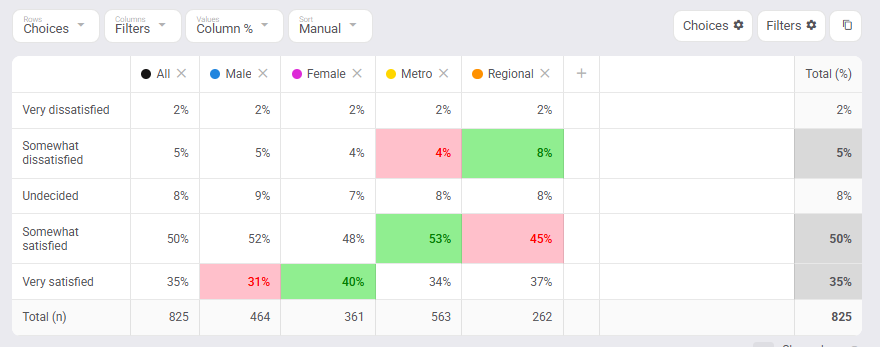
Seeing green and pink cells? That's Glow's automatic significance highlighting comparing segments — it appears on some Values and is independent of which Value you pick.
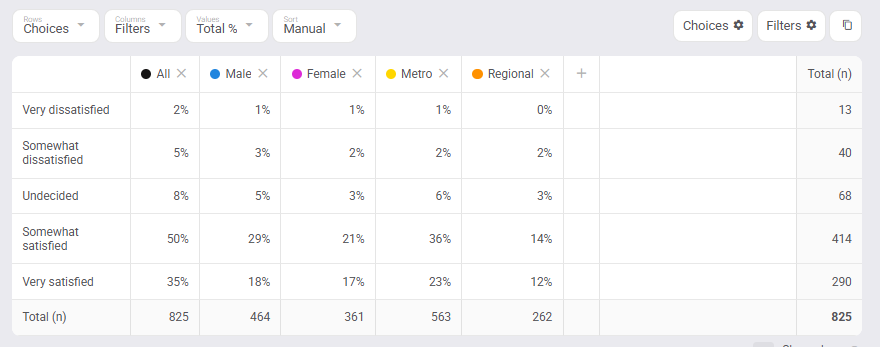
Total % — "What share of everyone lands in this one cell?"
Total % divides every cell by the overall base (the bottom-right total). 242 ÷ 825 = 29% of all shoppers are somewhat-satisfied males. Use it when you want every cell expressed as a share of the same whole.
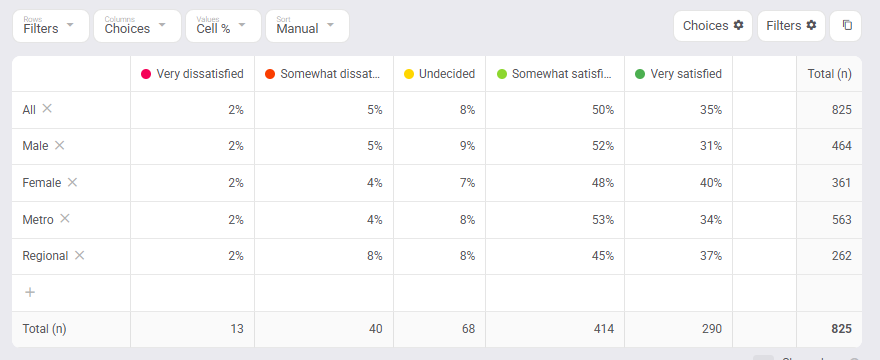
Rearranging the table — why Cell % is the safe percentage
Swap Rows and Columns and watch our cell. On Cell %, nothing happens — 52% stays 52%, along with every other number in the table:
On Column %, the same cell silently becomes 58%:
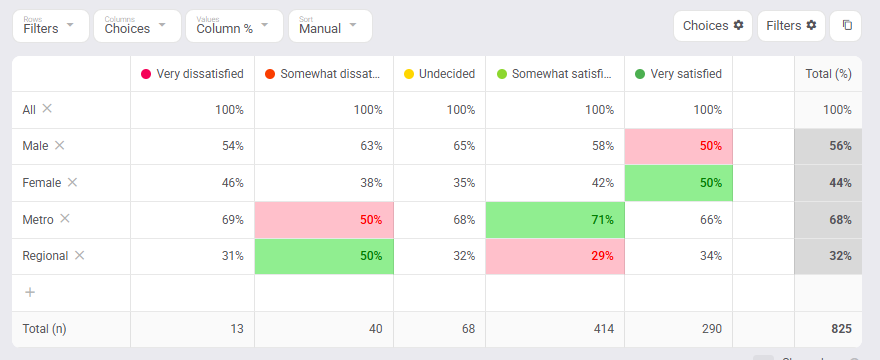
Same cell, same 242 people. The swap changed the denominator from "males asked" (464) to "everyone somewhat satisfied" (414), so the number quietly changed meaning — it became what Row % said before the swap. Row % mirrors the same trap in reverse. Cell % is the only percentage that keeps meaning exactly what you said, however you arrange the table.
Sum & Average — "How many points? What's the typical score?"
Sum and Average work with scores, so choice questions need scores first. Open the Choices config (top right, above the table), give each choice a score, tick Combine Weighted, and click Done:
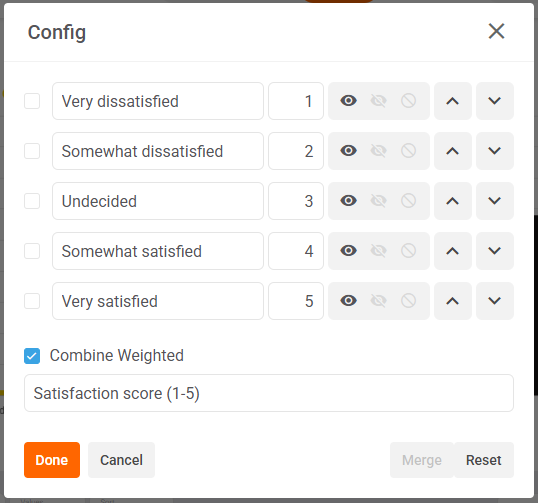
Sum multiplies each count by its score and adds them up. For males: (7×1) + (25×2) + (44×3) + (242×4) + (146×5) = 1,887 satisfaction points.
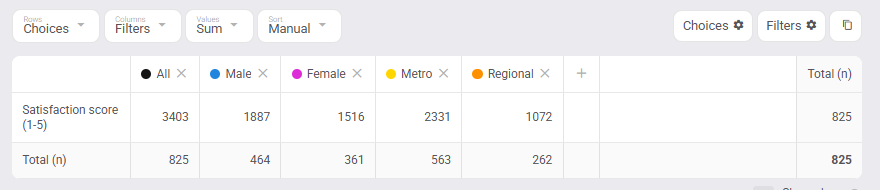
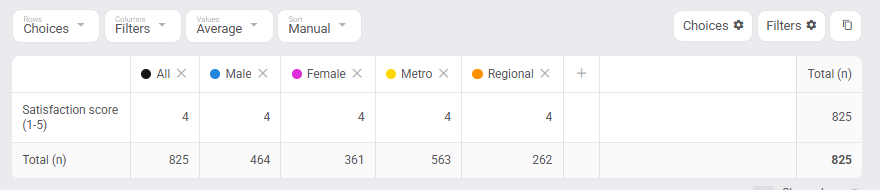
Average divides that Sum by the people asked. Males: 1,887 ÷ 464 = 4.07 out of 5; females average 4.20 — women rate the checkout slightly higher. The table rounds to whole numbers (both display as "4"), while the chart above the table plots the exact values.
To get back to counts and percentages, open the Choices config again and untick Combine Weighted. (We know this switch takes a few clicks — a one-click version is on the roadmap.)
FAQs
Why do Cell % and Column % show different numbers for the same cell?
Different denominators. Column % divides by the column total; Cell % divides by the people who answered that item. Both are correct answers — to different questions. The decision table at the top shows which sentence each supports.
Why don't my Cell % figures sum to 100%?
Each Cell % is an independent share of the people asked. On single-answer questions they will sum to 100% across the choices; on multi-select questions or focused views they aren't meant to.
What exactly counts as "people asked"?
Everyone who answered at least one choice for that item (that statement or loop), after the table's filters are applied.
Did my existing tables change when Cell % arrived?
No. Existing tables keep the Value they were saved with. Only new tables start on Cell %.
Can I see the counts behind a percentage?
Switch Values to Count — the layout stays put, so you can flick back and forth.
Why do Sum and Average just repeat the counts (or show 1 everywhere)?
The choices have no scores yet. Add scores in the Choices config and tick Combine Weighted, as shown above.