Dashboards.
Your data can be analysed across multiple dashboards. Use dashboards (top left) to focus attention and share relevant insights with specific stakeholders.
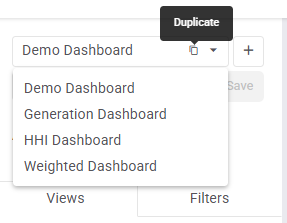
To create:
- click the '+' button in the dashboard bar OR
- click the Duplicate icon to copy an existing dashboard (filters included)
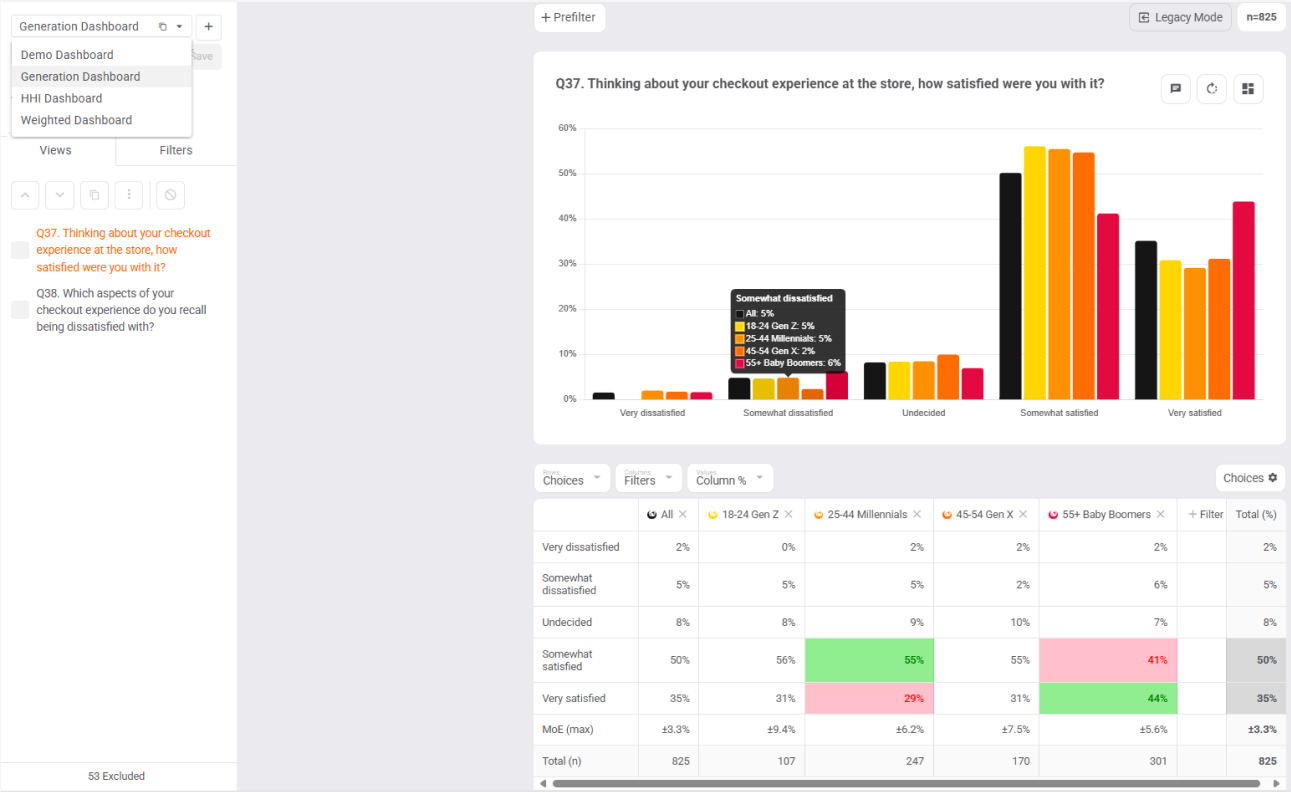
Examples:
- a Generation dashboard for age-based insights
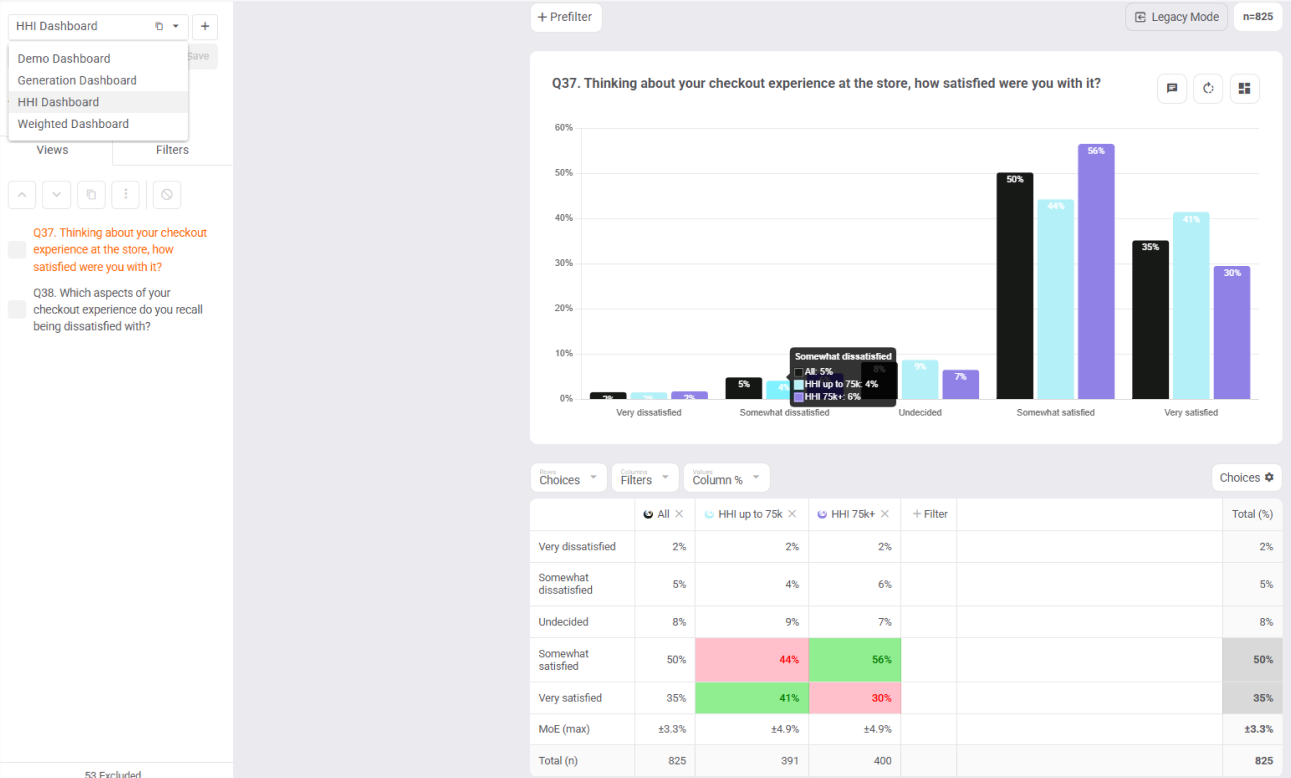
- a Household Income dashboard for financial comparisons
Create as many dashboards as you like.
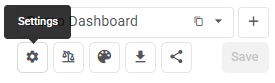
To rename your dashboard:
- click the 'cog' icon in your dashboard bar to open the dashboard's settings.
- rename your dashboard in the 'Name' field.
- click 'Apply'.
- click 'Save'.
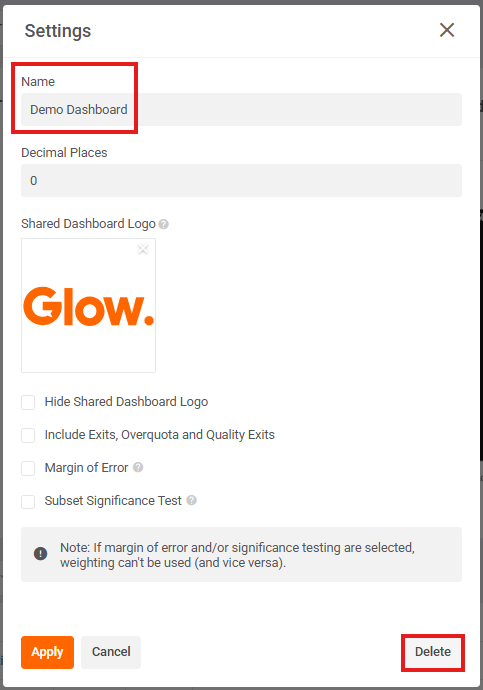
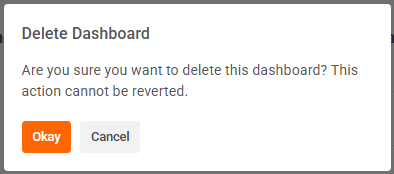
To remove a dashboard:
- click 'Delete' at the bottom right of the dashboard settings.
- then click 'Okay' to delete dashboard permanently or 'Cancel' to keep it.
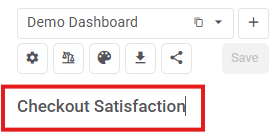
Note: to edit your survey title (under the dashboard bar):
- Click on the survey title or highlight want you to edit.
- Start typing!
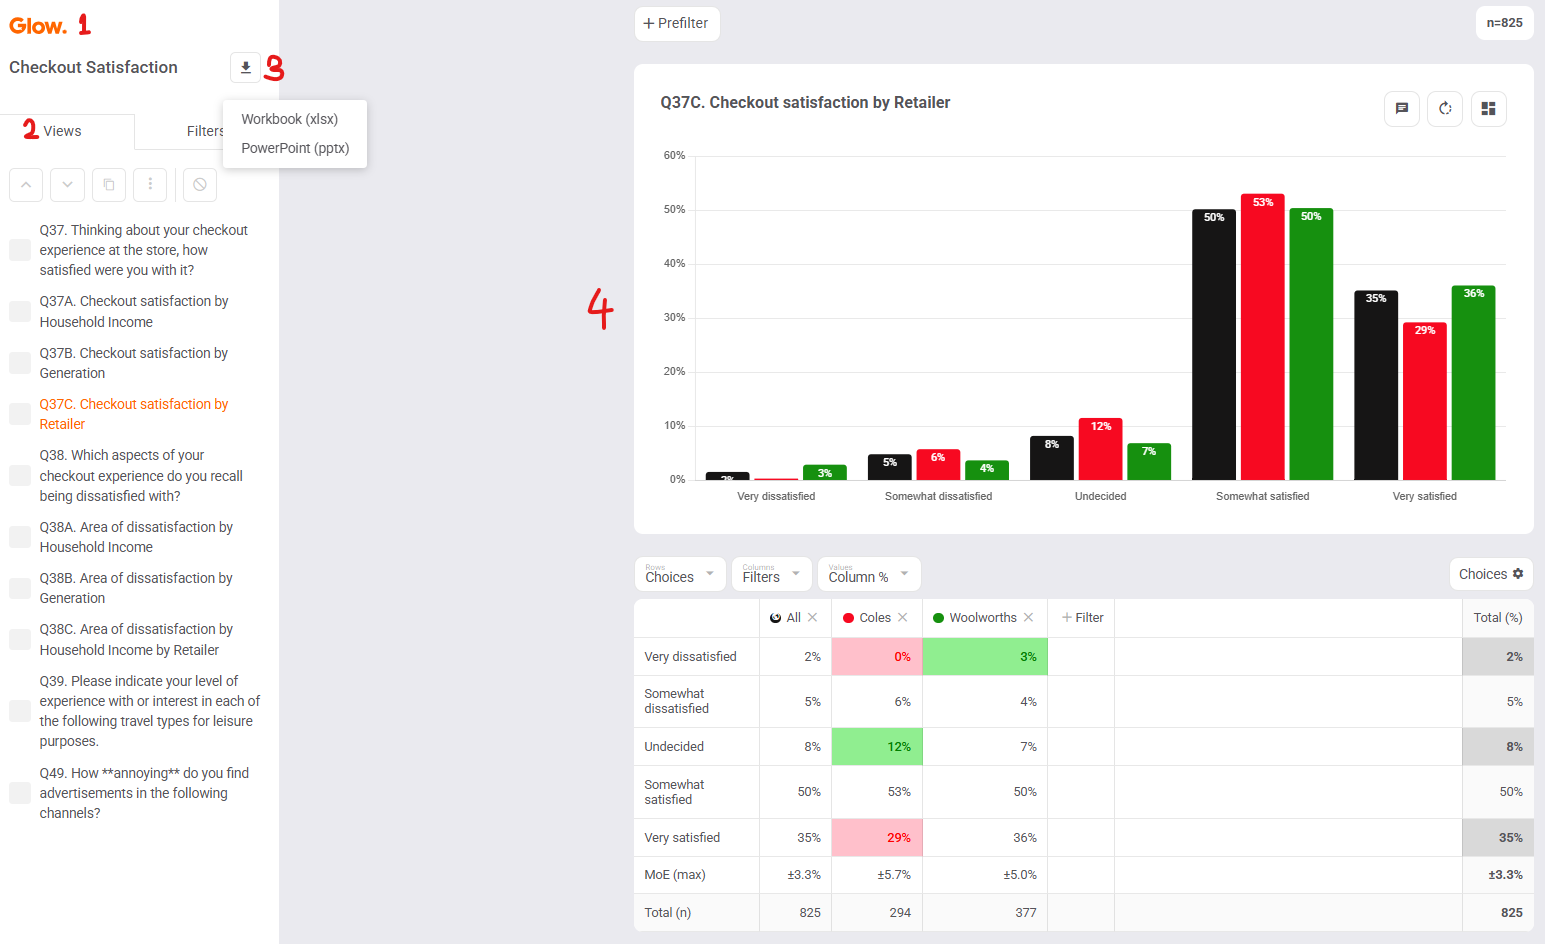
E.g. change "Have your say!" to "Checkout Satisfaction".
- Click 'Save'.
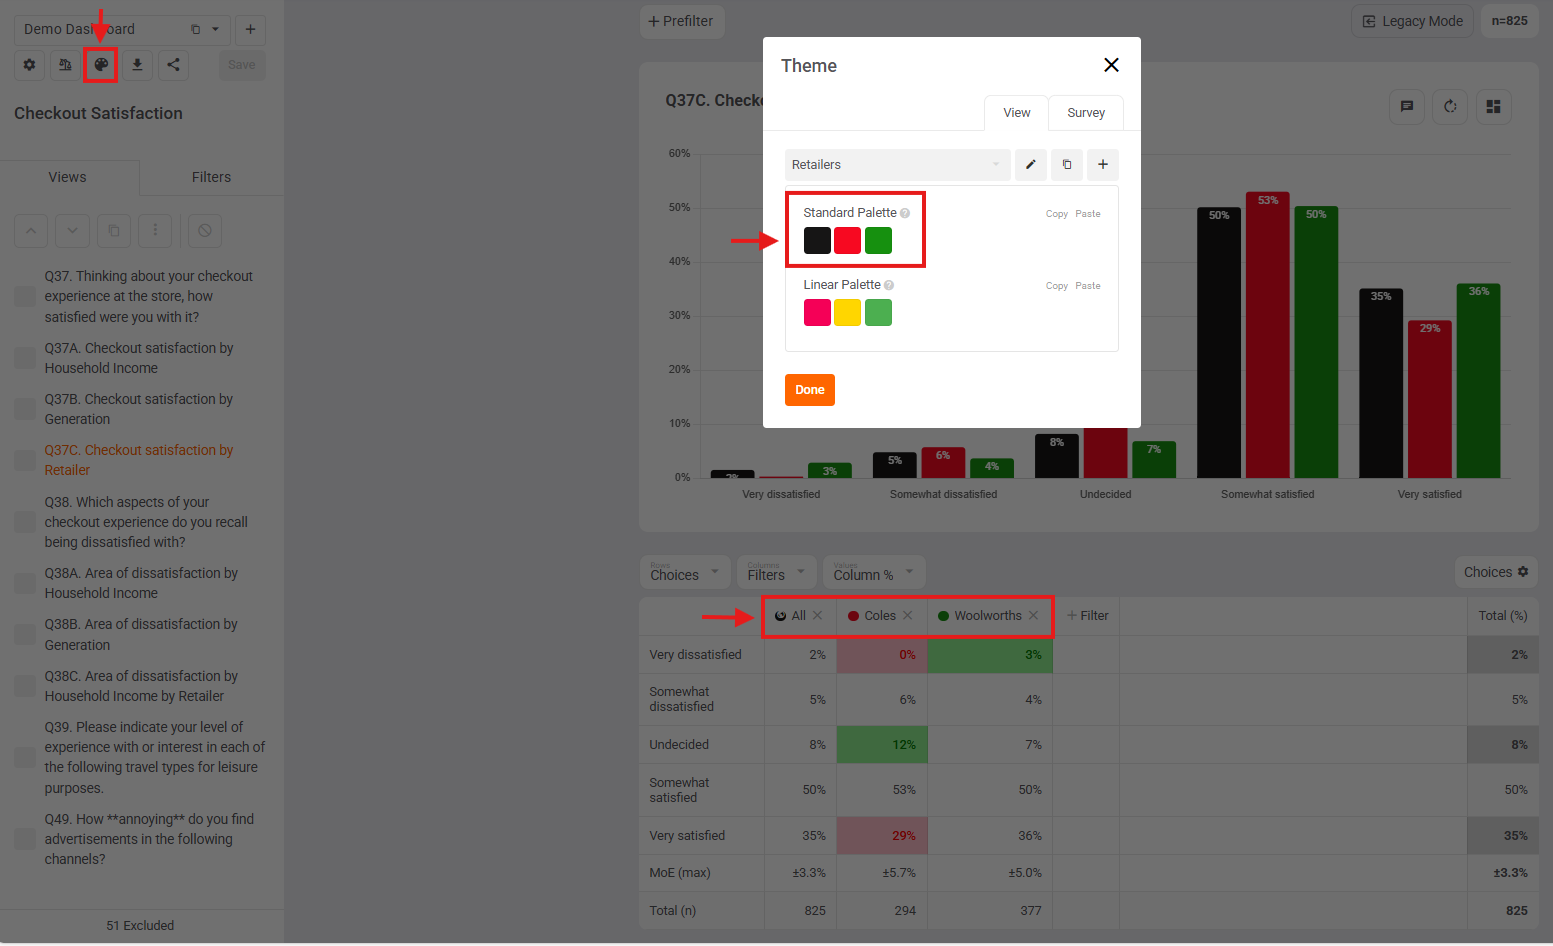
To update your chart palette:
- Click the Theme icon on the left
- Pick a palette - or create your own
- Apply it to a single view or all views in dashboard.
Want to align your dashboard to a brand colour? Easy.
Example:
- Woolworths green
- Coles red
- All black
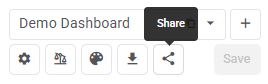
Click the 'Share' icon to generate a public link to your dashboard.
Within the shared dashboard, your clients will see:
- Your logo (top left)
- Only the views you've included (none of the views you've removed or made private)
- The ability to download their own Workbook or PowerPoint
- Full flexibility to:
- use and create their own filters.
- reconfigure their tables and charts
However, any custom analysis your clients do in the shared dashboard (no login needed) will revert / realign to whatever's saved in your subscriber dashboard (requires user login) when the page is refreshed.
Want to take data out in another format? Glow's got you covered.
Back in your subscriber dashboard, you can:
- Download all data tables to Excel (1 tab per view)
- Download all charts to PowerPoint (1 slide per view)
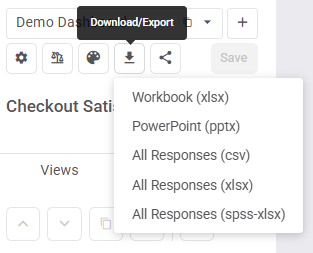
One click, for structured, ready to use data or charts.
For full raw data exports:
- CSV (text based) - good for general use, e.g. in Q
- XLSX (numeric) - clean structure for deeper analysis, e.g. in Excel
- SPSS compatible XLSX (numeric) - ready to import into SPSS (.sav) for advanced stats.
You'll find these options in the Download tab.
In your dashboard bar and settings, you'll also find...
That's the basics of Glow's dashboards.
In just a few clicks, you can:
- create new or duplicate dashboards
- rename, remove, and restyle your dashboards
- share and download dashboards
Insights shouldn't be complicated.