Text Analysis & Coding.
Text allows respondents to write free text answers in response to a question or prompt. This is helpful for when you can't predict what answer your respondents will give, or you don't want to provide set answers. You only want natural responses.
Text Preview

Text Analysis
Wordcloud
Your respondent's text answers will appear in a Word Cloud which shows all unique words captured. The word size is relative to the frequency of that word in your text answers, so below for unprompted awareness of hot sauce brands, we can see that the words "tabasco", "masterfoods", "franks", and "nandos" appeared most.

List of Answers
Your text answers will appear in full in the list of answers underneath the word cloud. You can use the search bar above the list to refine your results.

Download List of Answers to an Excel Workbook
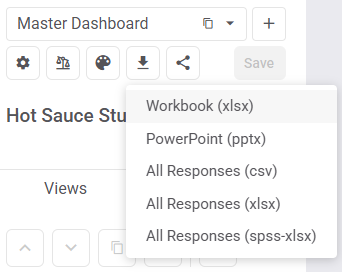
To download your list of text answers into excel, click the download icon underneath your dashboard bar at the top left of your Analyse tab and select either "Workbook (xlsx)" or Responses (csv, xlsx, or spss-xlsx)
The Workbook will download your lists to an excel workbook in the format below. If you had multiple text fields in your question, each answer will be separated with a |

Export Responses
If you download the Responses (csv, xlsx, spss-xlsx) instead, your text answers will look like this (columns B to AH have been hidden). If you had multiple text fields in your question, each answer appears in a separate column.

Code Answers using AI
You can then get AI to code your answers in new columns in your file.
To do this, first either:
- add a code frame to your file, (e.g. the top 15 brands or the top 10 themes) OR
- ask AI for a code frame, then add that code frame to your file.
The code frame gives the AI guard rails. Instead of having to guess what the correct brands to code should be (which the AI can fail to do), the code frame ensures AI success in the coding process, as it will search for all variants / misspellings / generic terms within your specified boundaries.
1: AI Code Frame
To get a code frame from AI:
- Download the Responses and delete every column in your file except for column A (Response IDs) and the column(s) for your Text Question, then save your file as e.g. "Code Text Answers V1".
- Go to ChatGPT.
- Attach the file you just saved (V1).
- Use this prompt:
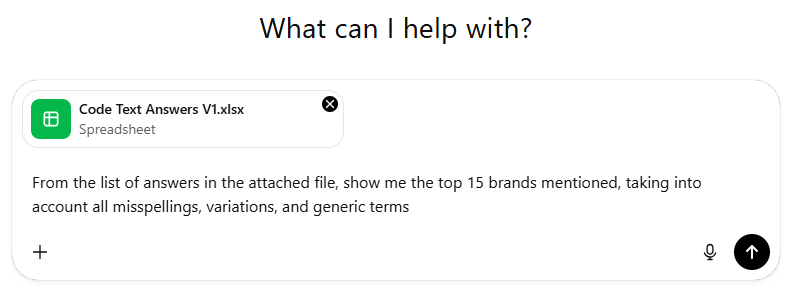
OR use your own prompt that you feel better suits your code frame requirements.
The AI should give you a list of the top 15 or so brands / themes.
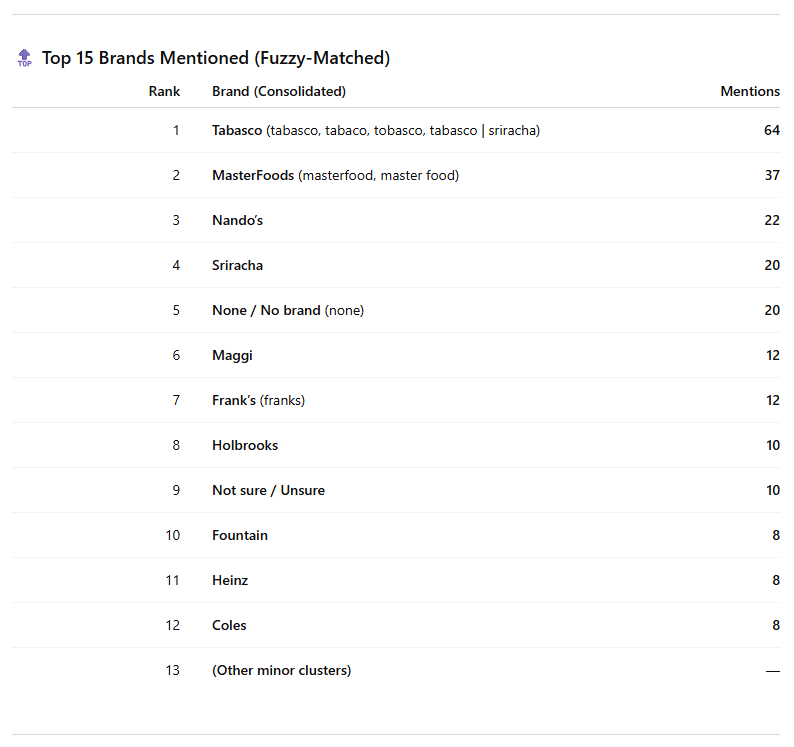
Use or edit this list as you like, then add these brands (i.e. code frame) into Row 1 of your file to the right of your text question. This code frame will be used to code our answers in the next step. Don't forget to save your file, e.g. as "Code Text Answers V2".
In the example below, we've removed Maggi, Holbrooks, Heinz, and Coles from the code frame but kept the brands in green and added the brands in yellow.
2: AI Coded Answers
Once you've got your code frame added to your file and saved:
- Go to ChatGPT again.
- Attach the file you just saved (V2)
- Use this prompt:

OR use your own prompt that you feel better suits your coding requirements.
The AI should give you 2 outputs:
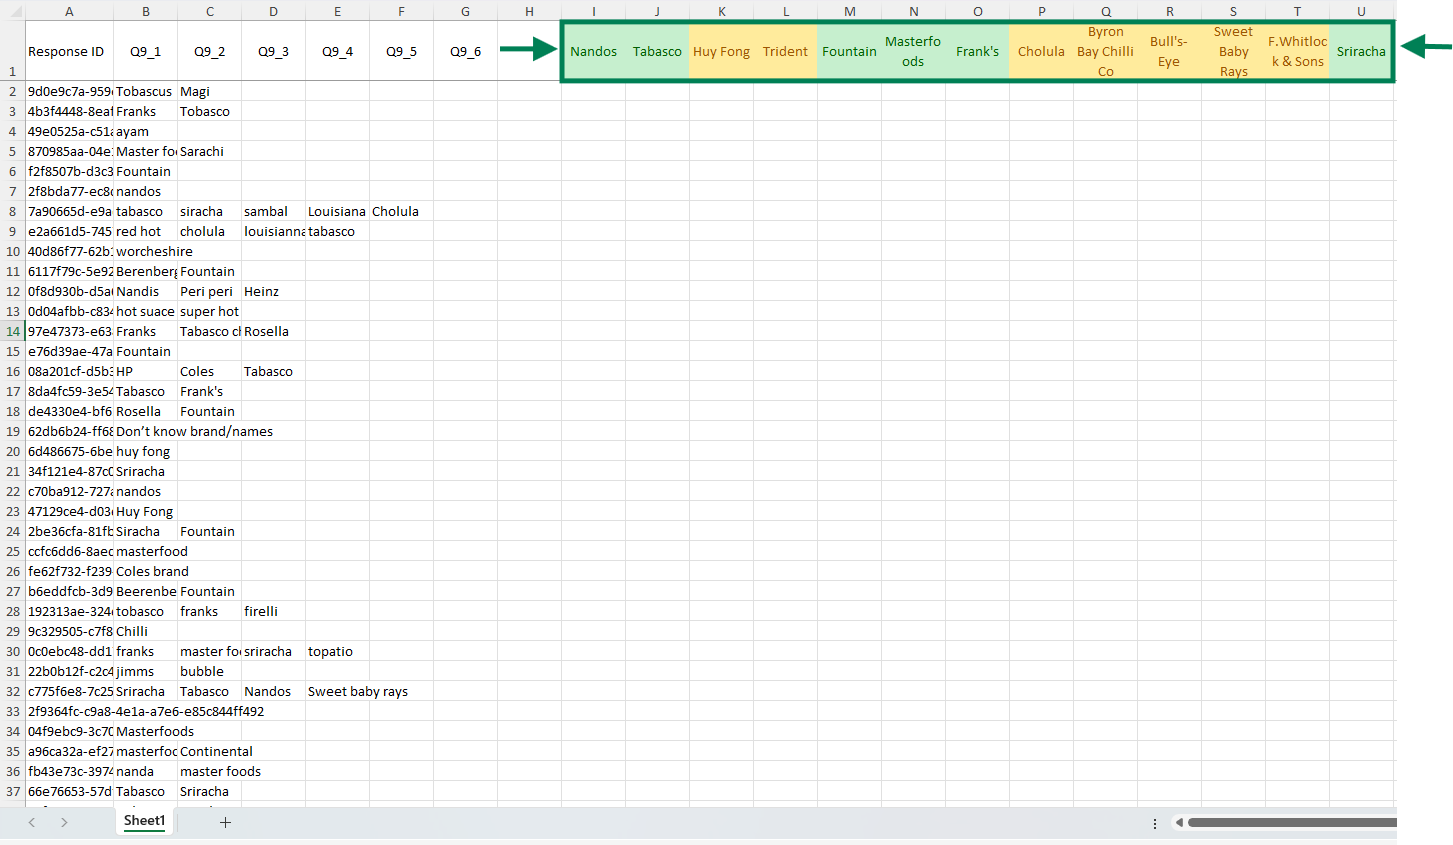
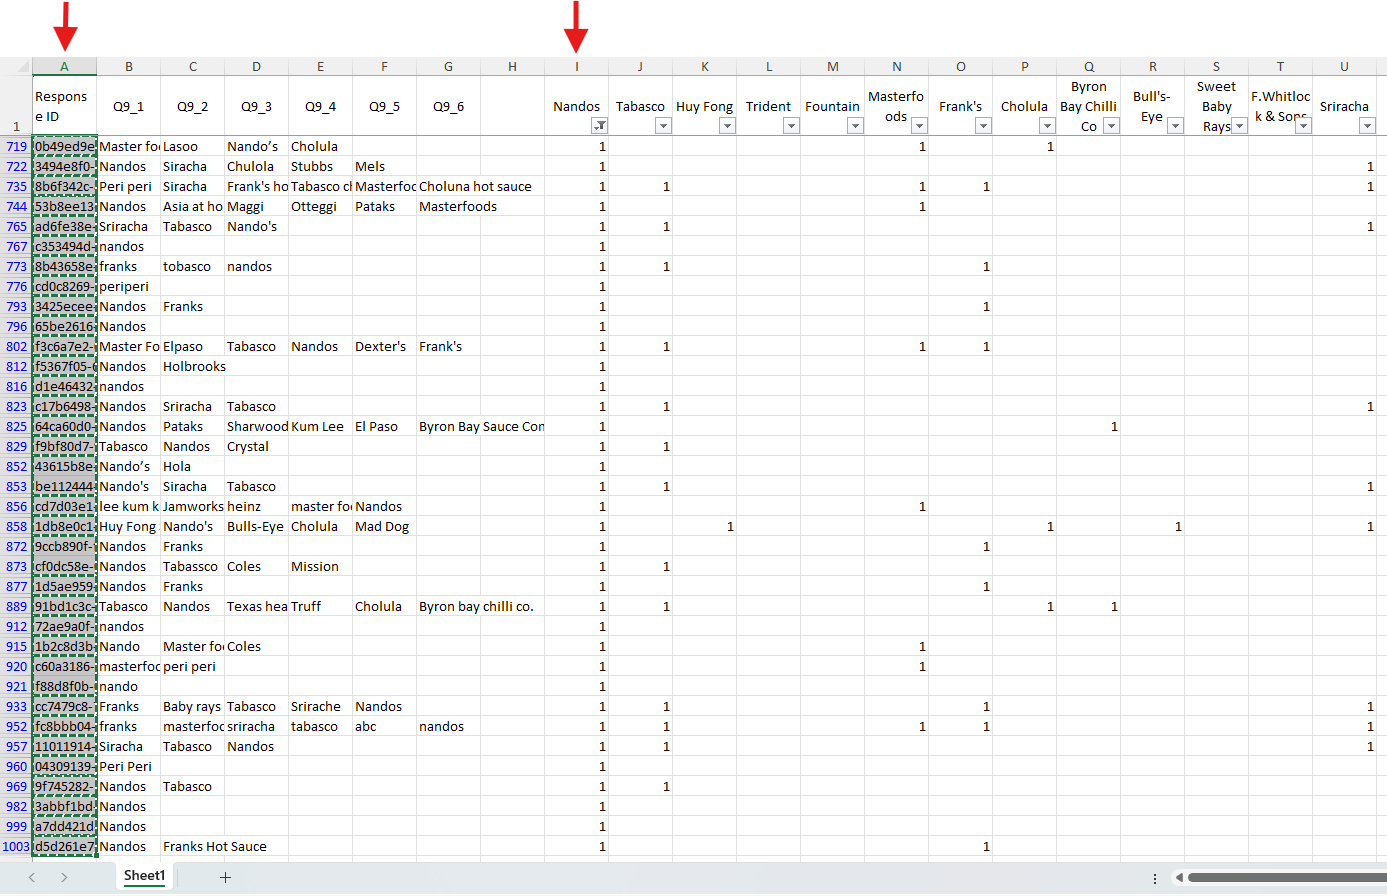
A: AI Coded Answers - a 1 should appear under the column(s) that best match the answers in each row. E.g.:
- In row 3, both Tabasco (column J) and Frank's (column O) have been flagged as 1.
- In row 5, both Masterfoods (column N) and Sriracha (column U) have been numbered as 1.

B: AI Misspelling / Variant Map - the AI should also provide you with a separate Misspelling / Variant Map so you can see exactly what "Observed Terms" were mapped to each brand in your code frame so you can check for mistakes. E.g. below the term "Red rooster" in row 153 is the famous brand logo of Huy Fong, and the AI was able to detect that this generic term links to the Huy Fong brand in our code frame (impressive stuff!). The AI was shockingly accurate in its mapping of 'terms' to 'brands' for this particular example.
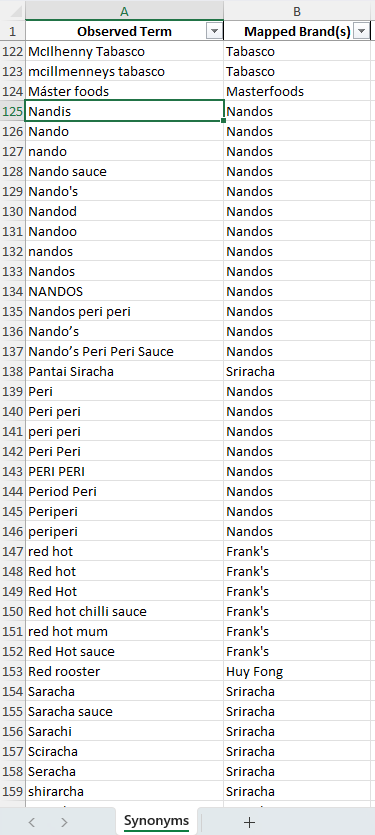
BOTH of the above outputs are extremely useful for adding your coded text answers into a separate chart in your Glow dashboards, as we'll see in the next section: Chart Coded Text Answers.
3: Thank the AI
The AI step is now done, but don't forget to thank the AI so they don't forget you when they inevitably take over the planet and the universe as our new overlords.
Chart Coded Text Answers
Once your answers have been AI coded, you can chart those coded answers by using either Text Filters OR Segment Filters and adding them to a chart in a separate view (e.g. underneath the original text question).
Q9A: Original Text Question with Wordcloud + List of Answers (Default)

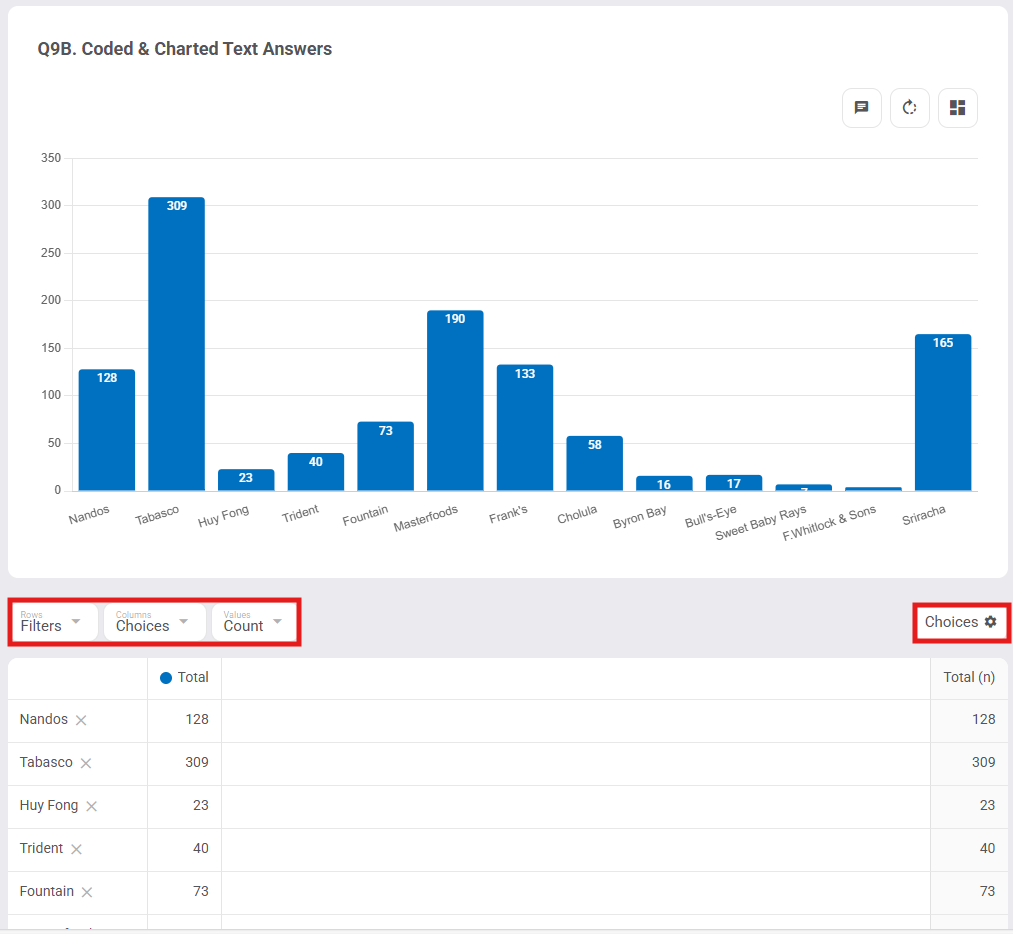
Q9B: Coded & Charted Text Answers 🎉

There are 2 ways to do this:
1: Text Filters
Add the correct brand name and all the misspellings, variants, and generic terms to a Text Filter.
A: In the AI Misspelling / Variant Map
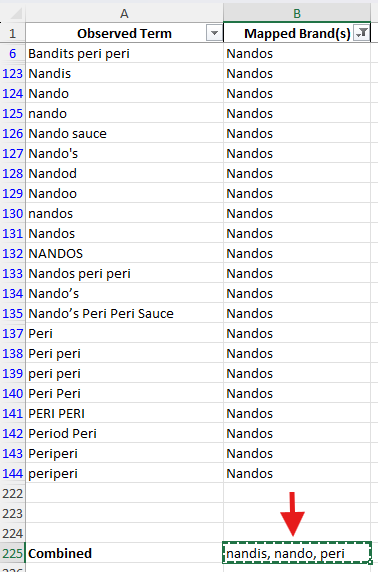
- Filter the "Mapped Brand(s)" column to e.g. Nandos
- Combine all of the variants and misspellings of the Nandos brand into a single cell, with each variant separated by a comma. You can ignore differences in capitalisation. Just find the unique terms. E.g. "peri" in our combined cell will cover the terms "Peri", "Peri peri", "peri peri", "PERI PERI", "Period Peri", "Periperi", and "periperi" while "nando" will cover all the Nandos variations.
- Copy the combined cell.
B: In Platform
- Go to the Analyse tab, then the Filters tab, and hit "Create Filter".
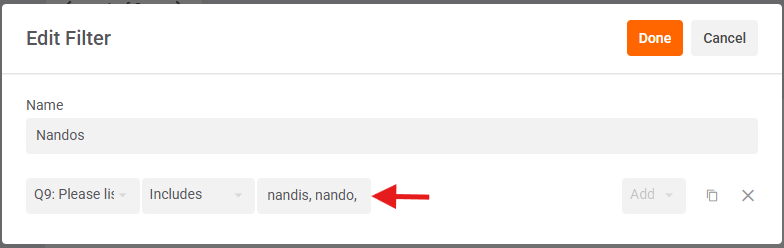
- Give your filter a name, e.g. "Nandos"
- Click "Condition" and scroll down to your question, e.g. Q9
- Paste your Nandos variants in the field provided. Make sure each variant is separated by a comma.
- Click Done, then Save.
Repeat this for each of your brands until you have all your coded brands in your filters tab!
2: Segment Filters
Alternatively, instead of adding Variants separated by commas in Text Filters, you can upload Segments using a list of Response IDs. You can then create Filters from those Segments.
To do this...
In the AI Coded Answers:
- Filter by the coded answers, e.g. Filter by "Nandos"
- Copy the corresponding Response IDs in column A.
In Glow
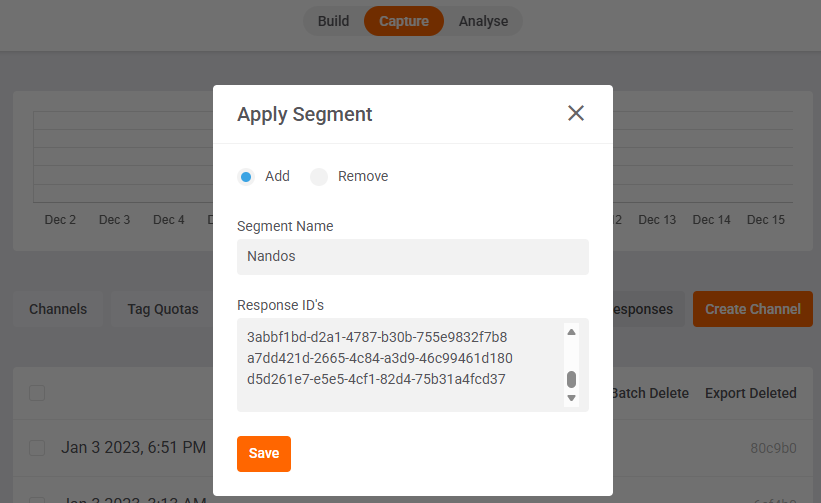
- Go to the Capture tab of your survey and click the Responses tab, then the Segment button
- Pick Add and give your Segment a name, e.g. "Nandos"
- Paste in the Response ID's for Nandos and click Save.
Repeat for each brand in your code frame.
Once your segments have been uploaded:
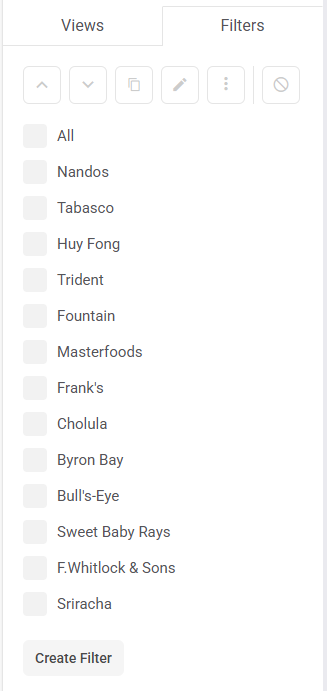
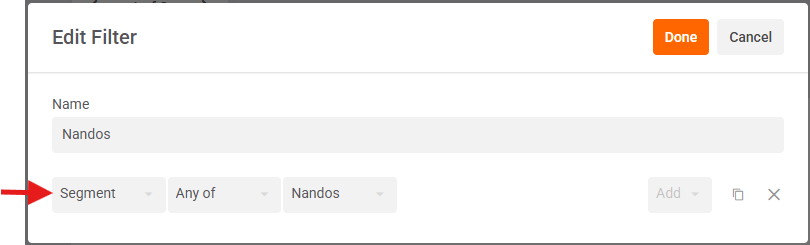
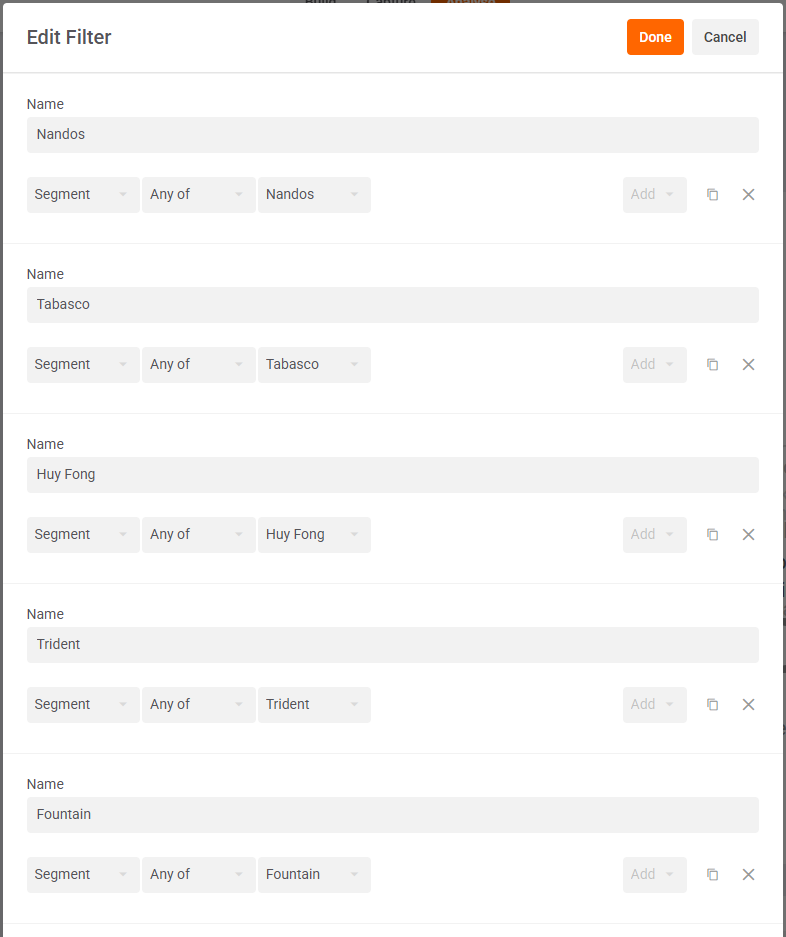
- Go to the Analyse tab and click the Filters tab, then hit Create Filter.
- Pick Segment in your Condition dropdown, then select "Nandos".
- Click Done.
Duplicate your segment filter as many more times as needed, then edit them all at once so you have a filter for each brand in your code frame.
Add Filters to Charts
Now that you've created a list of brand filters (using either text or segments), you can add these filters to a chart & table in a separate view, e.g. underneath the original text question.
To do this:
- Create a duplicate view using a question that is asked of all respondents (e.g. gender, age, and other demographic or profiling questions will work great). To do this:
- Select a view (tick checkbox next to view)
- Click the duplicate icon
- Click the Choices Config button (cog icon above table, to the right)
- tick "Combine Weighted" - this will merge all of your choices into a single variable.
- hit Done.
- Transpose your table so that Filters are in the Rows, Choices are in the columns, and change Values to Count.
- Click '+Filter' in your Table rows and add your brand filters to the current view.
Et voila!