Choice Question.
The Choice question type allows respondents to select one or more answers from a list.
It's:
- the most popular question type.
- the simplest question type.
- loaded with features.
To create a choice question:
- Go to the Build tab
- Click +Add Question/Section and choose 'Choice'
- Enter your question and choices and click 'Save & Close'.
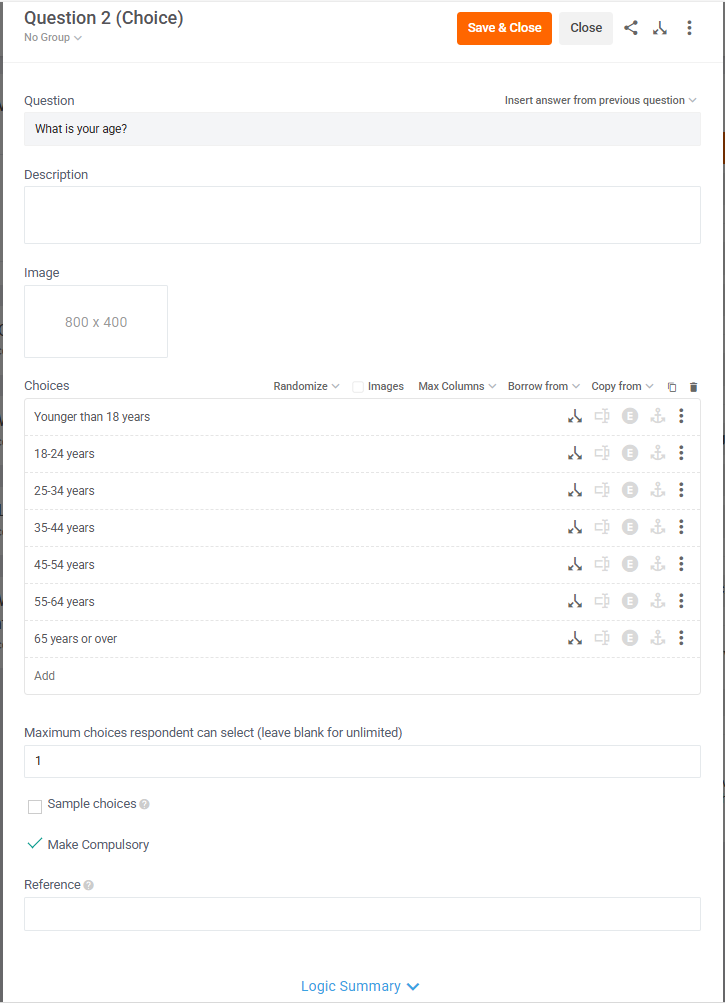
Choice Editor
Within choice questions, you can also:
- Insert answer from previous questions with {{ QX }}
- Add a description, e.g. 'select all that apply'
- Add a question image
- Add choice images
- Hide choice labels and show only choice images
- Add logic in line at the question or option level.
- See a logic summary
- Randomize choices and headers (groups of choices)
- Set maximum columns (Auto, 1, 2, or 3)
- Borrow from a previous question (carry forward)
- Copy from a previous question (hard codes choices)
- Group choices under Headers, e.g. Block 1, 2, 3, 4, and a 'blank' block.
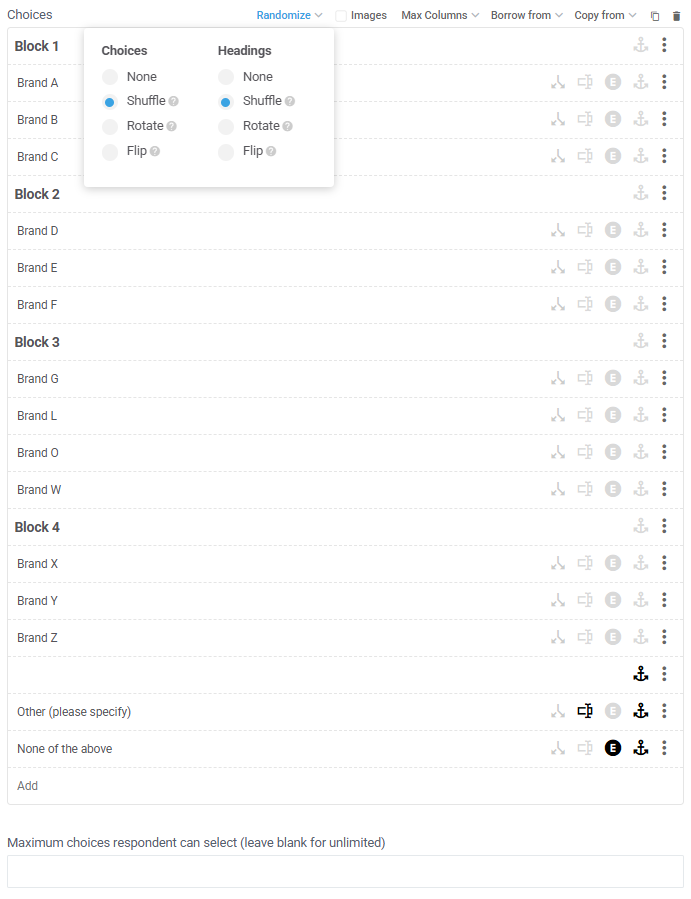
- Anchor (pin) choices, e.g. None or Other or 'blank' Header
- Make a choice exclusive, e.g. None of the above
- Enable text capture in a choice, e.g. Other (please specify)
- Set as single or multiple choice (within 'Maximum choices respondent can select' field)
- Sample choices (randomly displays x of y choices)
- Set question as compulsory or optional
- Add a Question Reference, i.e. custom question number.
- Share link to this question editor with other account users.
Estimated Question LOI: 10 seconds
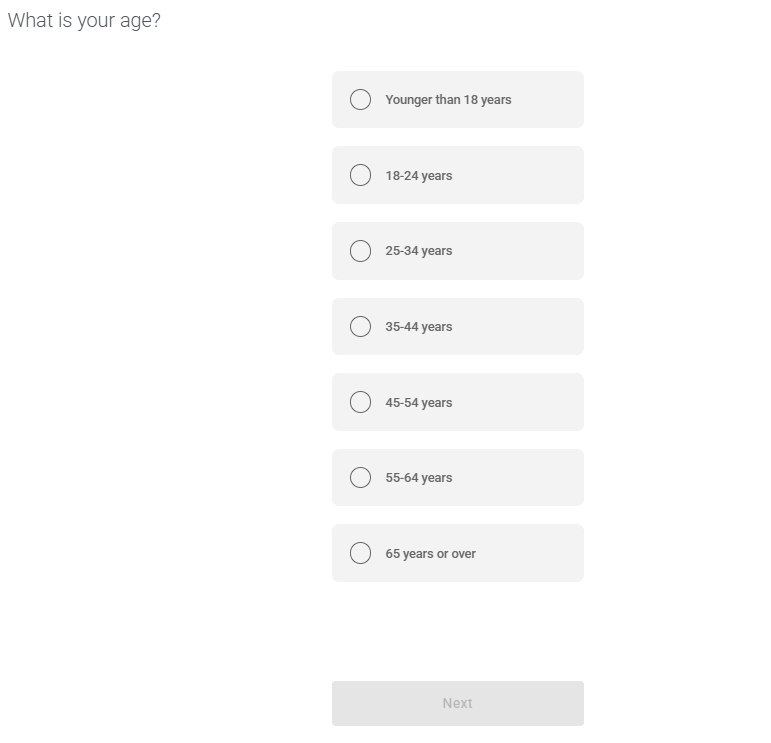
Choice Preview
Here's how choice questions look as...
- Single Choice (radio buttons)
- Single Column
- Multiple Choice (checkboxes)
- Multiple Columns

Choice Analysis
Choice is the easiest question type to analyze as there's only 1 dimension of data.
So, it's easy to cut by a 2nd dimension (filters).
1: Choices in Chart & Table
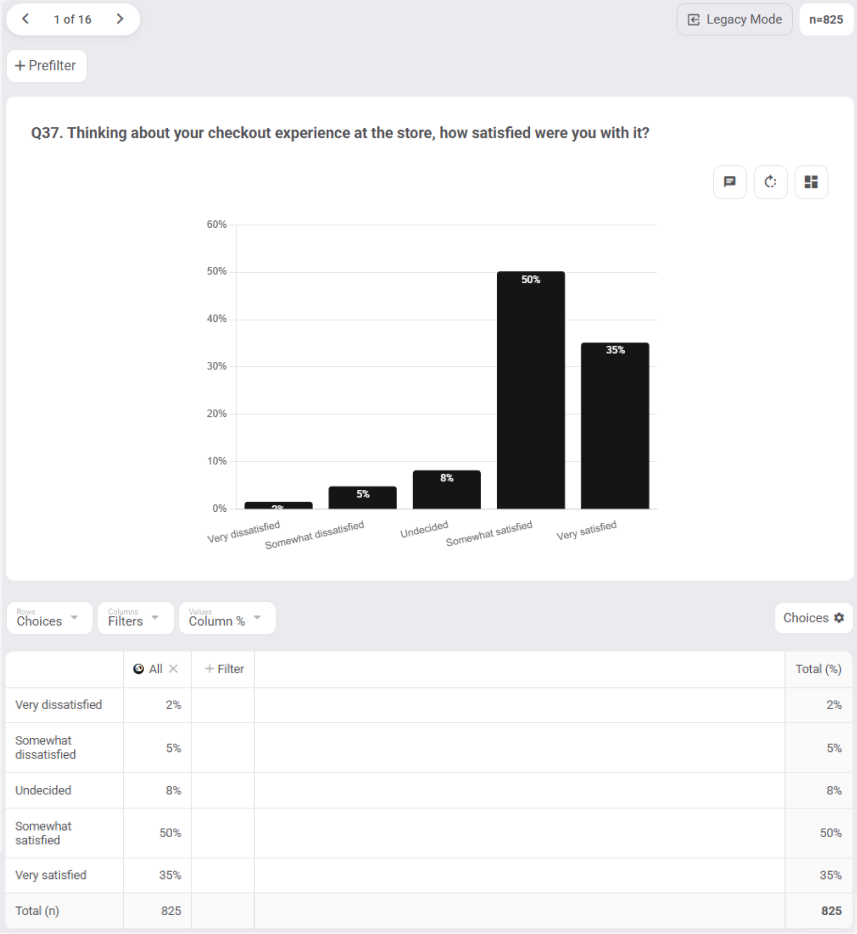
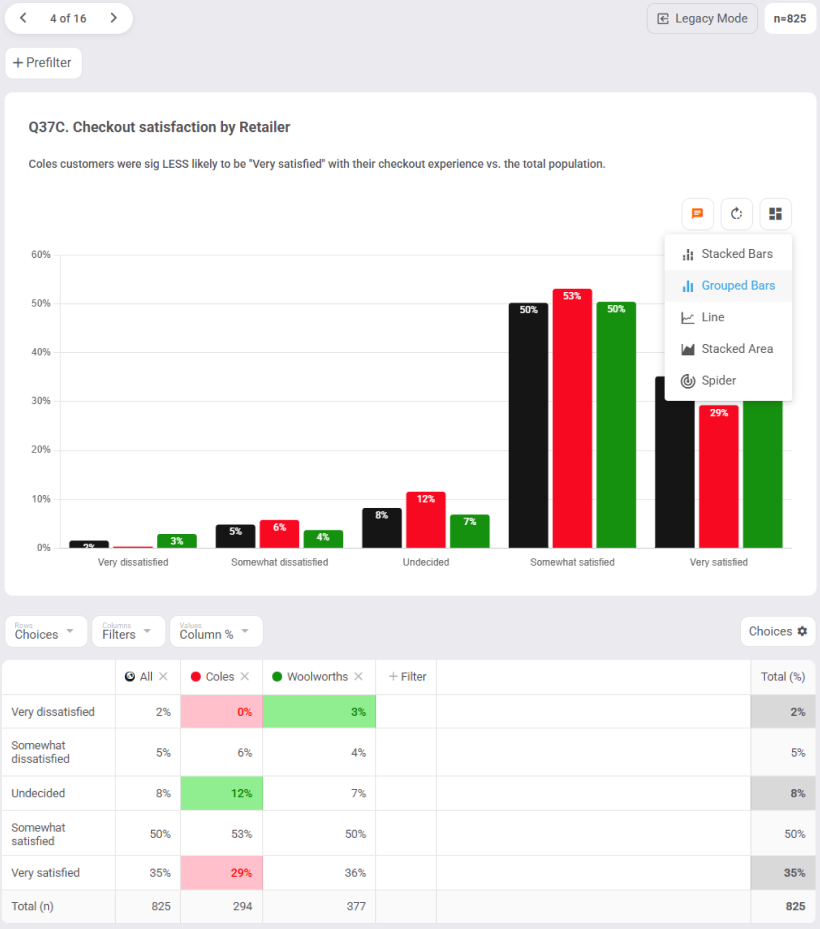
3: Chart Types - all chart types are available for choice questions, e.g.
A: Grouped Bars above
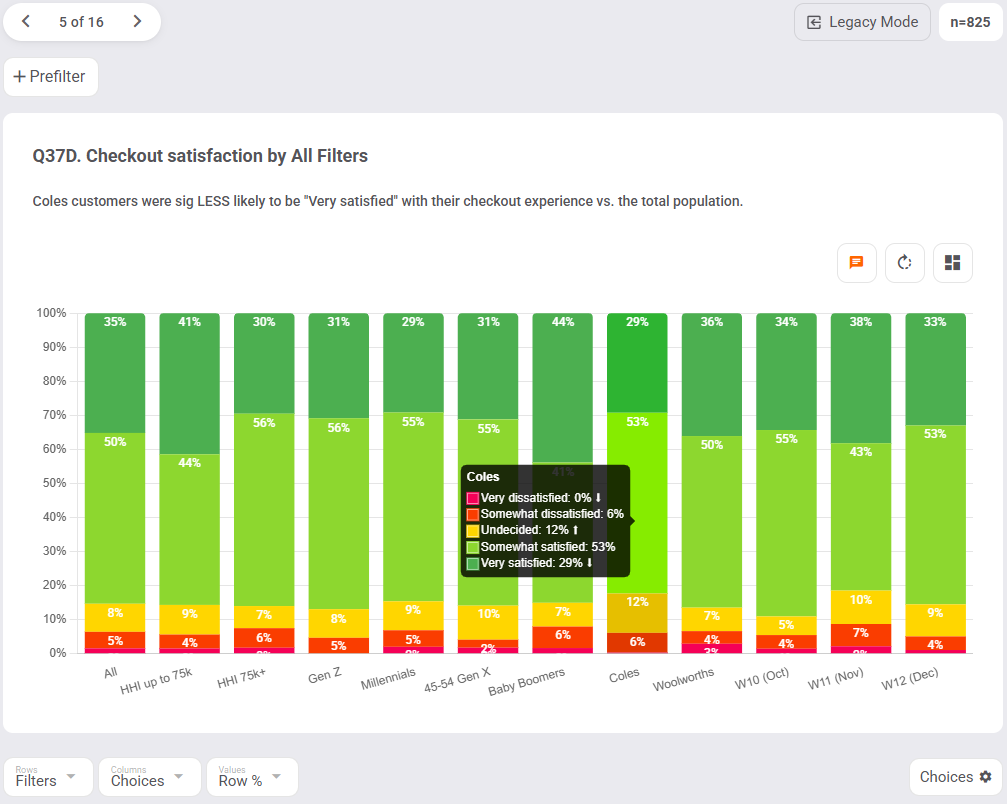
B: Stacked Bars below
C: Line Chart

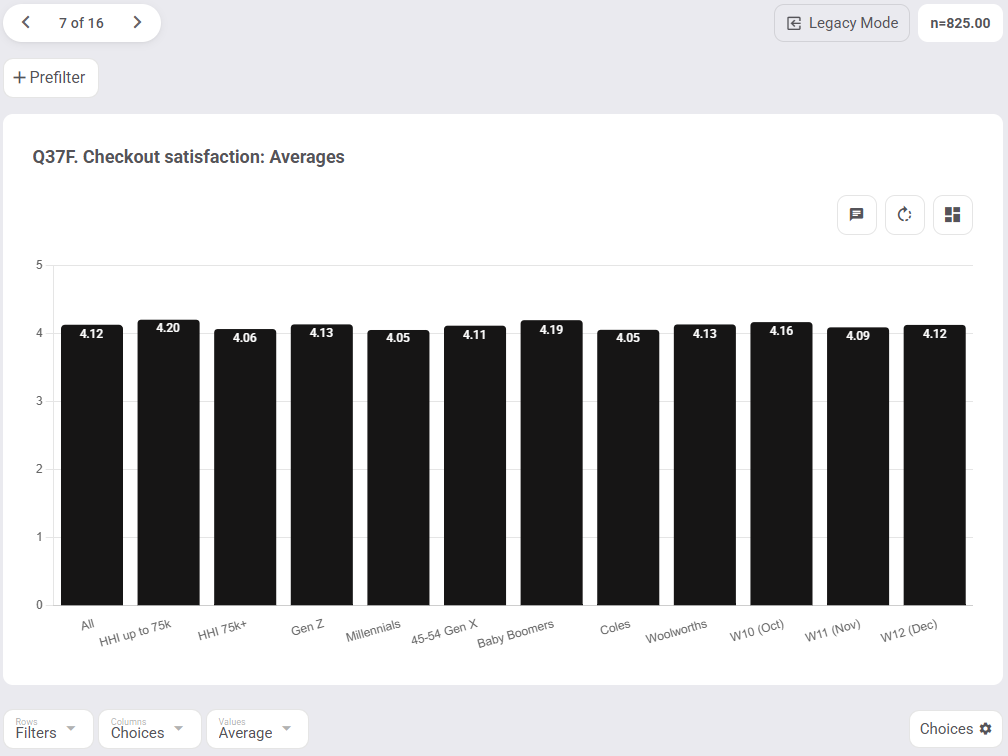
4: Score & Average Choices - you can assign a score to each of your choices and calculate the combined weighted average across all your segments. E.g.
- Very dissatisfied = 1 x 2%
- Somewhat satisfied = 2 x 5%
- Undecided = 3 x 9%
- Somewhat satisfied = 4 x 55%
- Very satisfied = 5 x 29%
- Average = 4.05 for Millennials
5: Top-2-Box analysis - your choices can be boiled down to a single metric, e.g. Top-2-Box.
